When the first set of September 2026 price concessions was announced on 16 September, we did something simple but important: we checked our own homework in public.
Ahead of the announcement, our September 2026 External Concession Risk Watchlist flagged the medicines we believed carried the highest concession risk. Once the official first-set announcement landed, we cross-checked every line against what we had predicted. Here is what the comparison showed.
The headline result
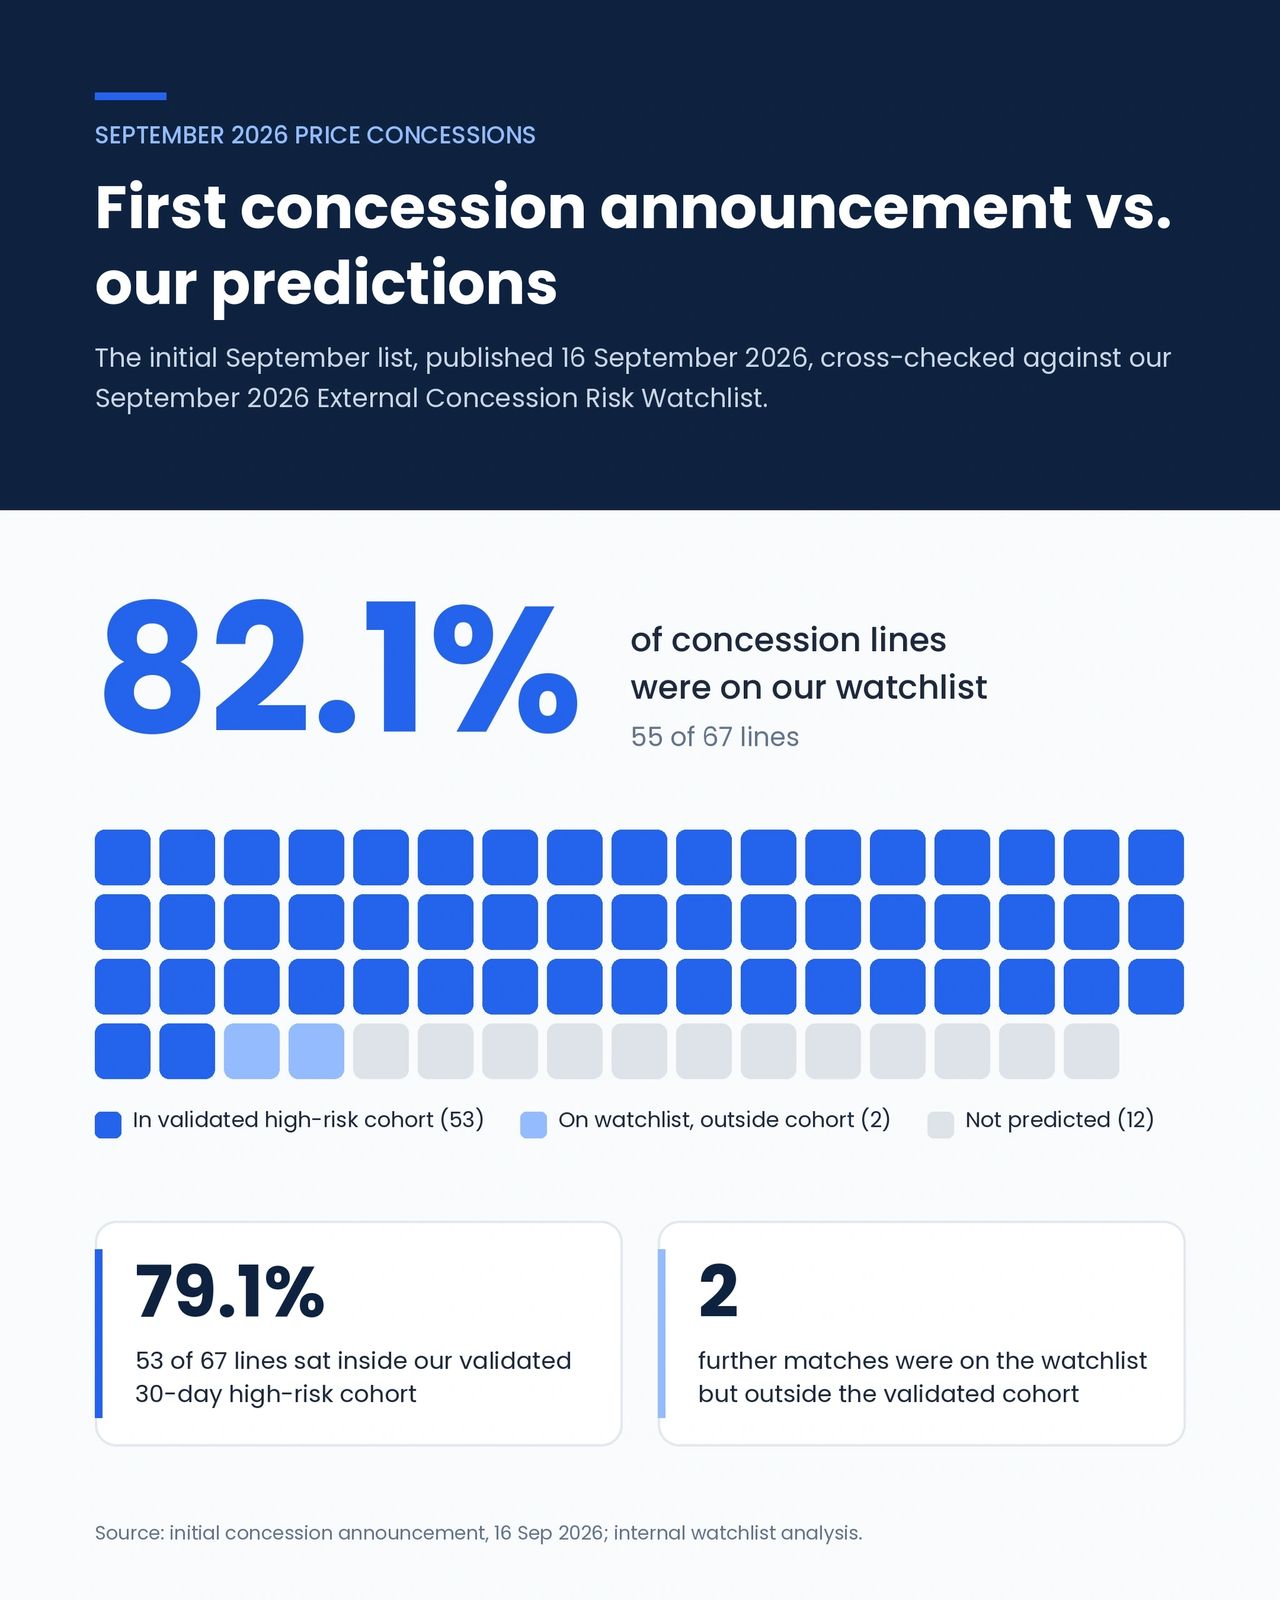
The first September concession set contained 67 lines. Of those, 55 were already on our watchlist -an overall coverage rate of 82.1%.
That figure alone tells part of the story. But it hides a more important detail. Of the 67 concession lines, 53 (79.1%) sat inside our validated 30-day high-risk cohort. In other words, the large majority of concessions were not just somewhere on our radar - they were in the group we had specifically identified as most likely to move within the next month.
We think that distinction matters, and it is worth explaining properly rather than collapsing everything into a single “82% accurate” claim.
Why “overall overlap” and “validated cohort” are not the same thing
It is tempting to reduce prediction performance to one clean percentage. We have deliberately avoided that, because it would misrepresent how the model actually works.
There are two different things being measured here:
· Overall watchlist overlap tells you whether a medicine appeared anywhere in our risk predictions. This is the broad net.
· The validated 30-day high-risk cohort is a much tighter group - the medicines our model actively ranked as high risk for concession within roughly 30 days.
A prediction that lands in the high-risk cohort is a stronger signal than one that merely appears on the wider watchlist. So when 53 of 67 concessions fall inside that validated cohort, it shows the model was not just casting wide. It was concentrating risk in the right places.
For anyone making procurement decisions, that second number is the one that carries weight.
The strongest individual calls
Coverage tells you whether we identified the right medicines. It does not tell you whether we understood the scale of the price pressure. That is a separate test, and it is where several of our calls performed particularly well.
On a number of medicines, the actual concession price landed inside or extremely close to the conditional price range we had modelled:
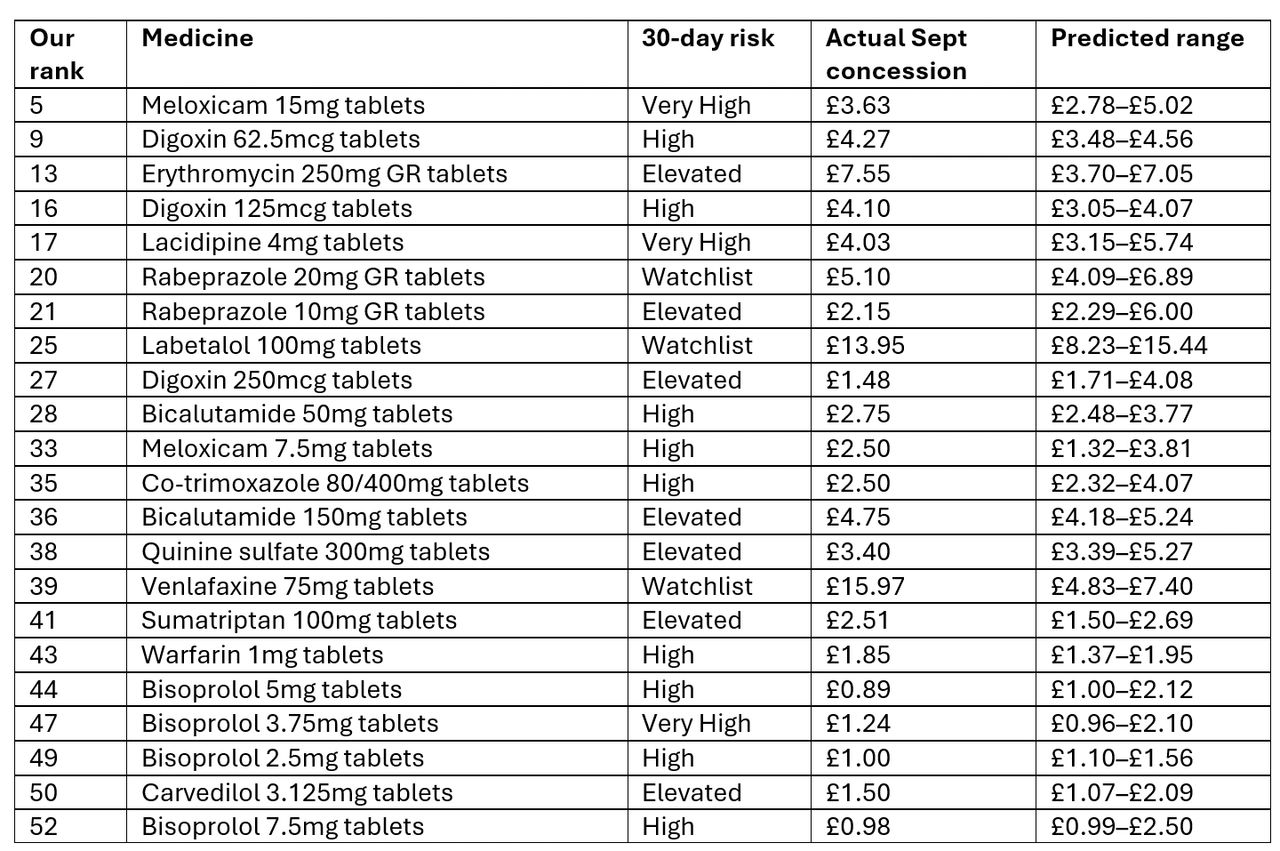
Look closer and the fit is even tighter than the ranges suggest. Meloxicam 15mg came in at £3.63 against a predicted midpoint of £3.65. Digoxin 62.5mcg landed at £4.27, sitting almost exactly on our upper-quartile estimate of £4.23. Warfarin 1mg reached £1.85, within our modelled ceiling of £1.95.
The comparison shows that connected supply, reimbursement and commercial signals can concentrate attention on medicines where concession pressure is emerging.
Two tests, not one
The most important takeaway is that this exercise measures two separate capabilities, and they should be read separately:
1. Concession identification -did we flag the right medicines? Here, 55 of 67 lines, with 53 inside the validated high-risk cohort.
2. Conditional price estimation -when a concession did land, did we predict the right price? Here, multiple lines landed inside or very close to our modelled ranges.
Reducing this to a single “accuracy” figure would blur two genuinely different questions. The denominator matters. The validated cohort matters. Collapsing them into one number would make the result easier to market but harder to trust -and trust is the point.
What this means across the medicines supply chain
For anyone with a commercial stake in medicines supply -whether that is a pharmacy, a wholesaler, a manufacturer, or a procurement team - the value of this comparison is timing.
By the time a concession is formally announced, the commercial and reimbursement implications are already in motion. For pharmacies, that means margin exposure. For wholesalers, it means pricing decisions already made against incomplete information. For manufacturers and suppliers, it means demand shifts they may not have anticipated. The September comparison shows that many of those medicines were identifiable earlier - through the signals already developing around them -giving each part of the supply chain a chance to act before the announcement made the pressure visible.
Portfolio Intelligence applies that same approach across the supply chain -whether you are managing a pharmacy portfolio, monitoring pricing exposure as a wholesaler, or tracking demand signals as a manufacturer. It prioritises the supply, pricing and concession risks affecting the medicines that matter to your organisation, giving you earlier sight of pressure before it reaches your margins, your pricing decisions, or your supply commitments.
The objective is not simply to explain why the market moved. It is to see the signals while it is moving.