In the spirit of British Science Week, our resident chemist-turned-data-analyst discovers that the best supply chain visualisations have a suspicious amount in common with Mendeleev’s finest work.
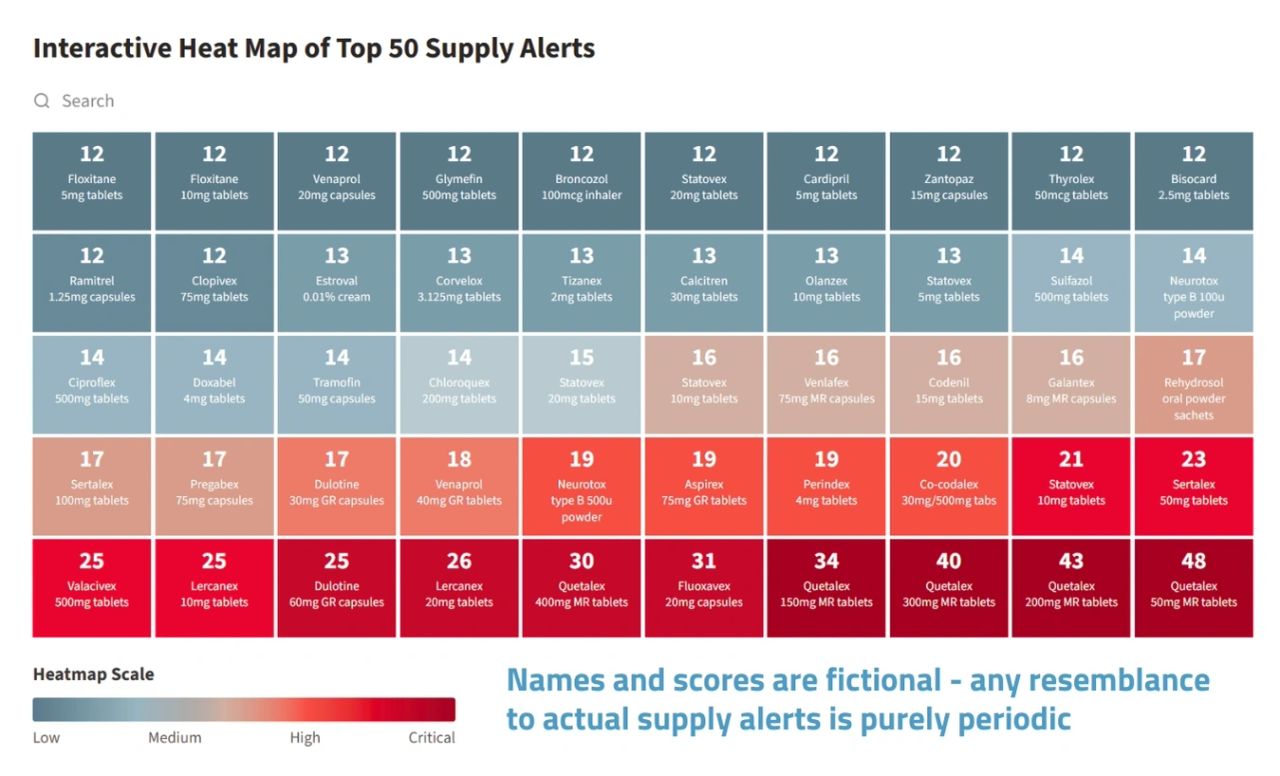
You know you’ve been a chemist for too long when you build a heat map of medicines shortages and your first reaction is:
“…hang on, why does this look like the periodic table’s cousin who went into pharmacy?”
Once a couple of colleagues pointed it out, I couldn’t unsee it. Rows, blocks, alarming colour gradients - the works. If Mendeleev had pivoted from element discovery to supply chain analytics, this would have been his masterpiece. And given that British Science Week exists to celebrate exactly this kind of unexpected scientific thinking, it felt like the right moment to lean into the comparison properly.
The parallels are, frankly, uncanny. Let me walk you through the chemistry of a crisis.
Therapeutic ‘Groups’ vs. Chemical Families
Every pharmacist knows that medicines can be grouped by how they behave. Every chemist knows the same is true of elements. Turns out, the families map across rather neatly:
The Stimulants - These have gathered together on our heat map rather like the Alkali Metals. Volatile, high-energy, and liable to react aggressively if you look at them the wrong way. Handle with care; store in a cool, dry place; avoid prolonged exposure to a procurement crisis.
Modified-Release Formulations - These look, at first glance, like the Noble Gases. Stable, unreactive, quietly reliable. Right up until the supply chain sneezes, at which point all nobility goes swiftly out of the window.
Alert Ranking = Atomic Number
In our heat map, every medicine carries a score. Think of this as its atomic number - the higher the number, the heavier the burden and the more unstable the situation.
In chemistry, high atomic numbers bring you radioactive decay, Nobel Prizes, and the naming of entire elements after your country. In medicines shortages, high scores bring you urgent emails marked ‘HIGH IMPORTANCE’ and a calendar invite for a meeting that could definitely have been an email. Close enough.
Colour Intensity = Reactivity
Any chemist will tell you that bright, vivid colours in the lab usually signal one of two things: something exciting is happening, or you should be heading for the safety shower.
In the lab: Vivid colour means rug down, goggles on, possibly evacuate.
In medicines shortages: Vivid colour on the heat map means a very different kind of emergency response - one involving stakeholder briefings, contingency planning, and industrial quantities of tea.
The Power of Pattern Recognition
Here’s where the analogy really earns its keep. Mendeleev’s genius wasn’t just in organising what was already known - it was in using the table’s patterns to infer what hadn’t yet been discovered. He left deliberate gaps for elements like Gallium and Germanium, confident they must exist. He was right.
Our heat map does something similar (if slightly less Nobel-worthy). By mapping patterns in shortage data - which medicines, which therapeutic areas, which time periods - we can start to anticipate where pressure is building before it becomes a full-blown crisis. We’re not discovering new elements, admittedly. We are, however, getting rather good at anticipating paperwork. Lots and lots of paperwork.
The Conclusion
This isn’t actually the periodic table - and thankfully contains significantly fewer things that will literally explode. But it serves the same fundamental purpose: helping us find order in apparent chaos, spot patterns before they cause problems, and ultimately keep patients safe.
Science, at its heart, is about looking at the world and asking: what’s really going on here? Whether you’re arranging elements by atomic weight or mapping medicines by shortage risk, the instinct is the same.
And if it occasionally allows a chemist to make periodic table jokes in a boardroom full of pharmacists? Well - as Mendeleev himself would probably agree - that’s just an added element of fun. 🧪
Published to mark British Science Week 2026 (6–15 March) - ten days celebrating science, technology, engineering and maths across the UK.